


News
2025.10.01 Wed
“JAXA/EORC Typhoon Database” Update – Added Observational Images of Typhoon Cloud “Cross-Sections” by the EarthCARE satellite “Hakuryu”
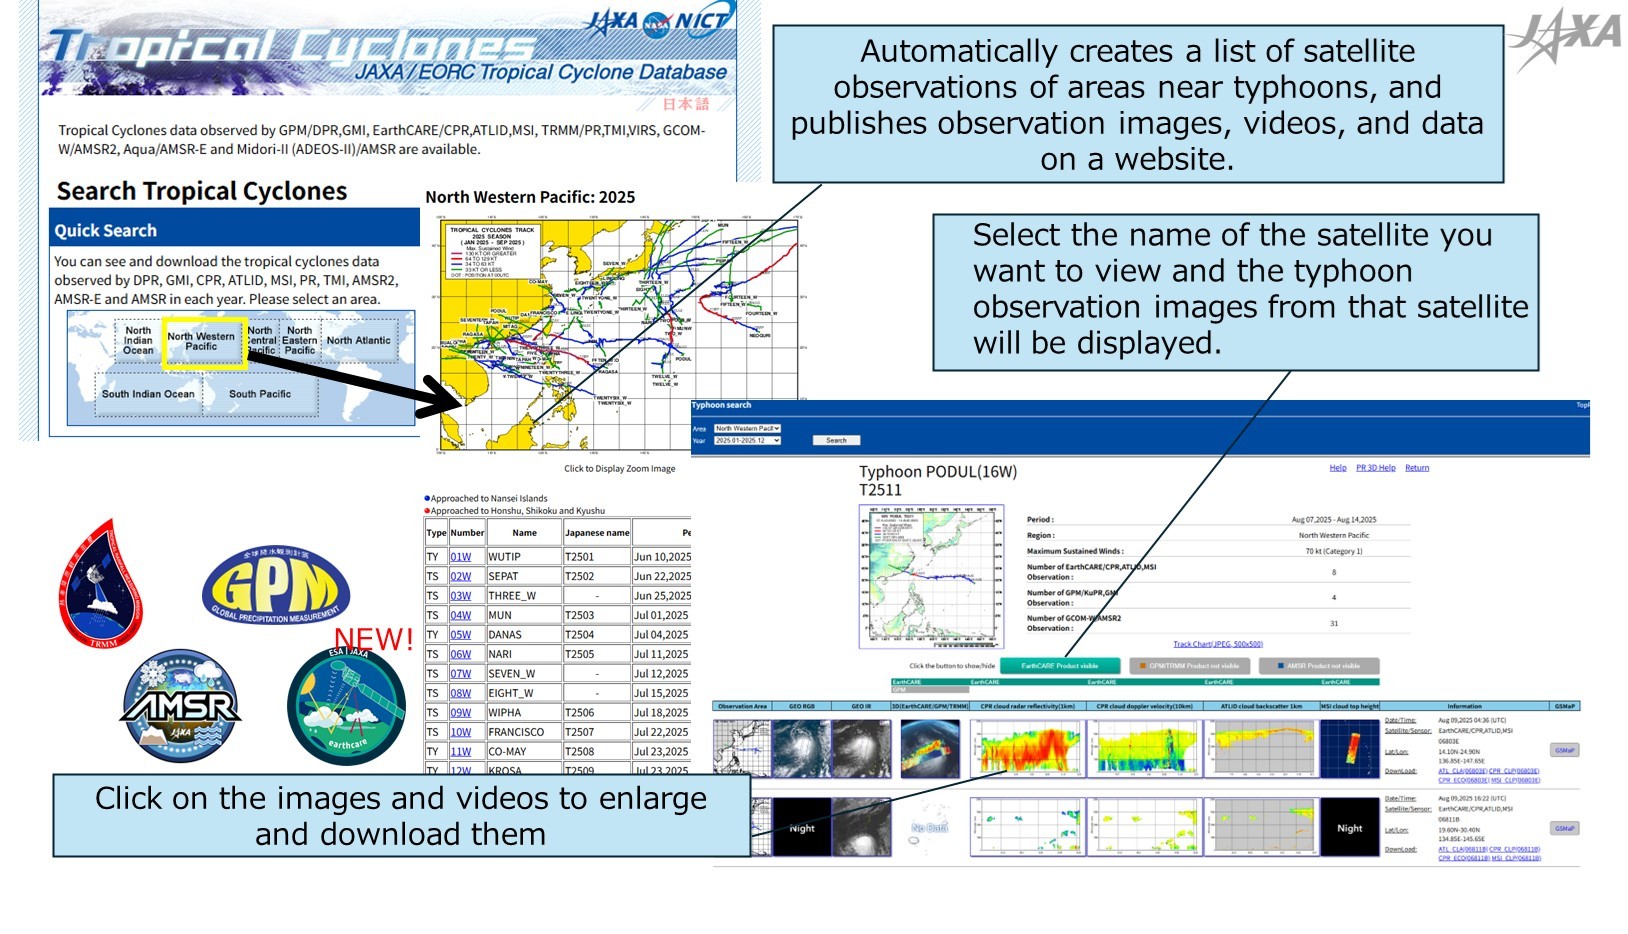
JAXA has launched the “JAXA/EORC Typhoon Database” website, which provides data on typhoons worldwide (including tropical cyclones such as typhoons and hurricanes) observed by the Tropical Rainfall Measuring Mission (TRMM), the Global Precipitation Measurement (GPM) Core Observatory, About Global Change Observation Mission – Water “SHIZUKU” (GCOM-W)), and others. The duration and paths of typhoons that occurred in each region, as well as the maximum wind speeds at each passing point, can now be understood at a glance along with various images and videos actually observed from satellites. Starting from 1st October 2025, new observational images captured by the Earth Cloud Aerosol and Radiation Explorer (EarthCARE) (Japanese nickname: Hakuryu), which was jointly developed with the European Space Agency (ESA), such as vertical cross-sections of clouds around typhoons and cloud images from the Himawari geostationary meteorological satellite, have been added to this website.
👉 JAXA/EORC Typhoon Database
https://sharaku.eorc.jaxa.jp/TYP_DB/index_e.html
👉 [Quick Report] Hurricane Humberto “Eye” captured by EarthCARE satellite (Hakuryu)
https://earth.jaxa.jp/en/earthview/2025/10/01/9051/index.html
This update includes data from “EarthCARE” and “Himawari,” illustrated with the example of this year’s Typhoon No. 18 (RAGASA).
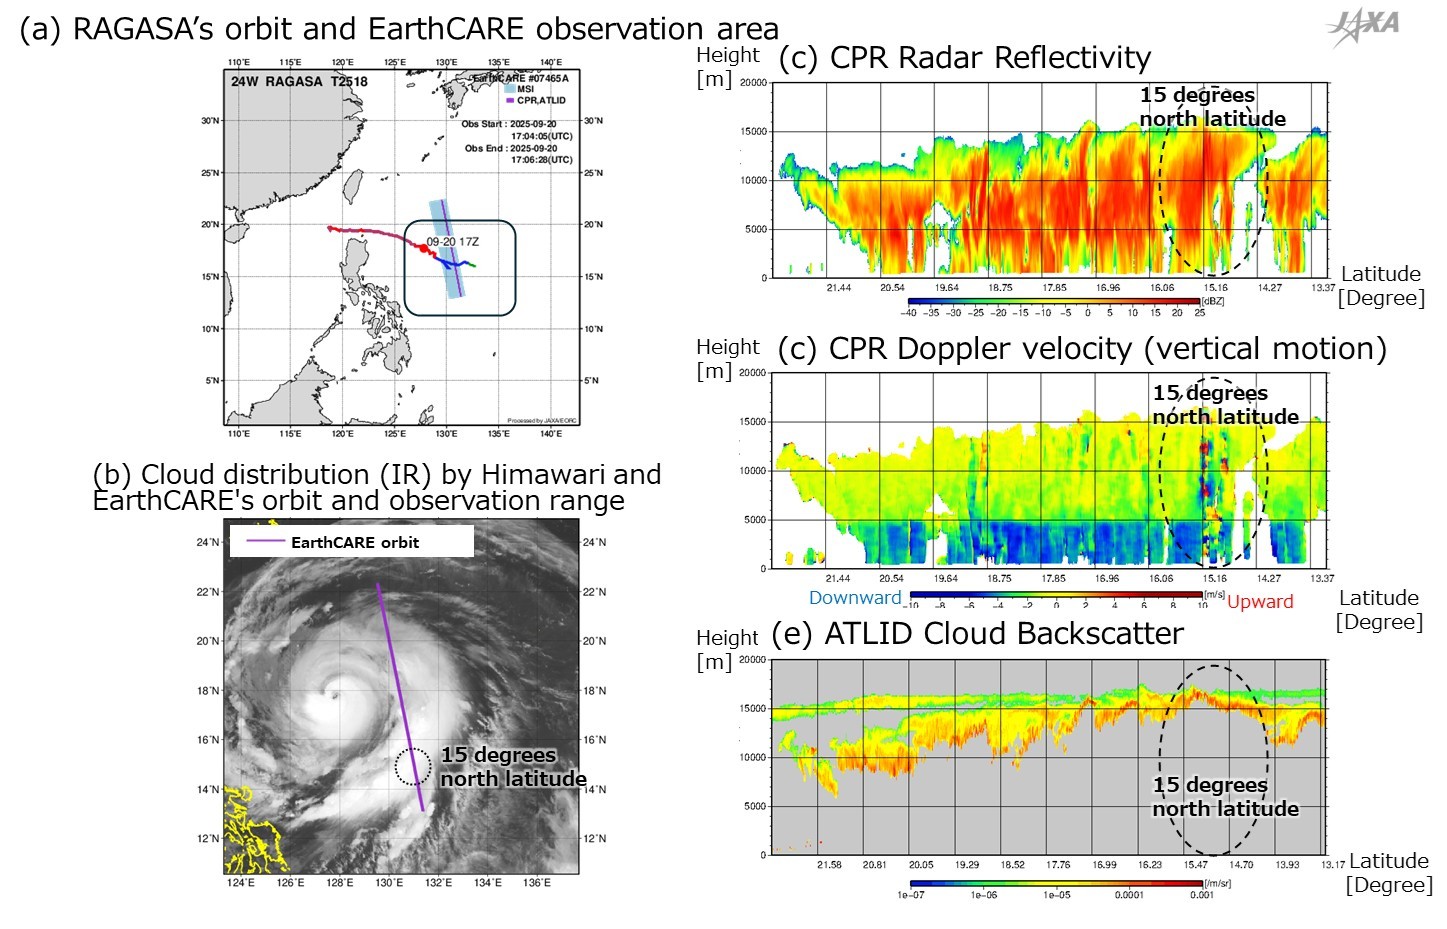
Figure 2 shows the observation images when the EarthCARE satellite detected spiral rain bands spreading to the east side from the typhoon center as RAGASA was moving westward over the sea south of the Southwest Islands on September 20, 2025. Figure 2(a) shows the track of RAGASA and the observation area of EarthCARE, and Figure 2(b) is the Himawari satellite image taken at nearly the same time as EarthCARE’s observation. EarthCARE passed along the path indicated by the purple line, and the observation images at that time are shown in Figures 2(c), (d), and (e).
In Figure 2(c), the Cloud Profiling Radar (CPR) radar reflectivity intensity shows that areas with higher values (red) indicate larger or more numerous cloud and rain particles. Looking at the cross-section of the clouds near 15 degrees north latitude, where the clouds spread spirally from the typhoon center indicated by the dotted line in Figure 2(b), Figure 2(c) shows that the clouds are thick and have grown to a high altitude above 15 km. Also, Figure 2(e) shows the observations by the Atmospheric Lidar (ATLID), which can detect thin clouds, indicating that thin clouds are spreading above the observation area of the CPR. By combining CPR and ATLID, a wider variety of cloud types can be observed.
The CPR Doppler velocity map in Figure 2(d) represents the vertical motion of cloud droplets and raindrops measured based on the Doppler effect. Below an altitude of 5 km, the values are generally negative (shown in blue), indicating that the particles are falling; in other words, it shows that rain is falling in the lower layers of the rain clouds. Furthermore, near latitude 15°N, the Doppler velocity values are large (shown in red), indicating that in the spiral thick rain cloud region associated with the typhoon, cloud particles are rising significantly.
EarthCARE observes typhoons and hurricanes around the world, including Hurricane Humberto, which formed off the east coast of the United States. Generally, there is a strong updraft around the eye of a typhoon and a downdraft in the center, which is related to the typhoon’s strength (development and weakening). On the other hand, t was difficult to conduct such observations on a global scale, including over the oceans where typhoons develop before the EarthCARE satellite was launched. Using the Doppler velocity measurement function of EarthCARE/CPR, it is expected that, for the first time in the world, the cloud motion can be observed on a global scale, contributing to the understanding of typhoon mechanisms and improving predictions.
The “JAXA/EORC Typhoon Database” has a function to generate and release 3D videos of rain and clouds based on observational data from the EarthCARE satellite and precipitation 3D structure data from the GPM Core Observatory. Figure 3 is a 3D video created from EarthCARE’s observation data shown in Figure 2. These videos will be posted sequentially on the website as they are created.
Figure 3. A 3D video of RAGASA observed by EarthCARE at 17:05 UTC on September 20, 2025.
The “JAXA/EORC Typhoon Database” is a website that publishes images and videos observed by satellites around such typhoons, aiming to collect information on typhoons, including past cases, as well as to be used for research and development related to typhoons. At JAXA, we are working not only to provide observational data, as on this website, but also to offer easy-to-understand information to the general public by releasing visualized images and videos. Through these efforts, we will contribute to understanding the current status of meteorological phenomena such as typhoons and improving the accuracy of forecasts.
Search by Year
Search by Categories
Tags
-
#Agreement
-
#Application
-
#Award
-
#Climate
-
#DAICHI (ALOS)
-
#DAICHI-2 (ALOS-2)
-
#DAICHI-3 (ALOS-3)
-
#DAICHI-4 (ALOS-4)
-
#Disaster Management
-
#EarthCARE/CPR
-
#Education
-
#GPM/DPR
-
#HIMAWARI
-
#IBUKI (GOSAT)
-
#IBUKI GW (GOSAT-GW)
-
#IBUKI-2 (GOSAT-2)
-
#KIZUNA (WINDS)
-
#SHIKISAI (GCOM-C)
-
#SHIZUKU (GCOM-W)
-
#Tour and Exhibits
-
#TSUBAME (SLATS)
Related Tags
Related News
- News 2026.05.12 Tue
- News 2025.12.01 Mon
- News 2025.11.27 Thu
- News 2025.07.08 Tue
- News 2025.06.30 Mon


